

In today’s shopping world, choices are like snacks at a party – plenty to pick from! If folks aren’t loving what you’re offering, they’ll just hop to the next virtual aisle. To keep your customers in the groove, it’s all about making them happy and keeping them loyal. Think of it like having a cool playlist for your online store!
Creating an e-commerce site isn’t just about what customers need right now. It’s about making them say, “Wow, this is my favorite store!” We want them to stick around like a catchy tune you can’t get out of your head. So, let’s make sure our online shop is the hit of the shopping charts! 🎶
Website
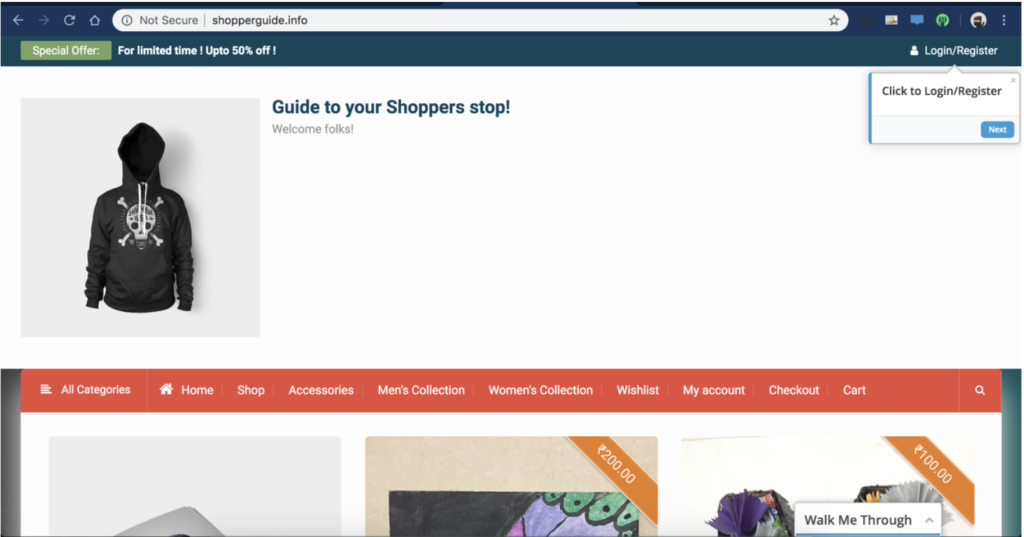
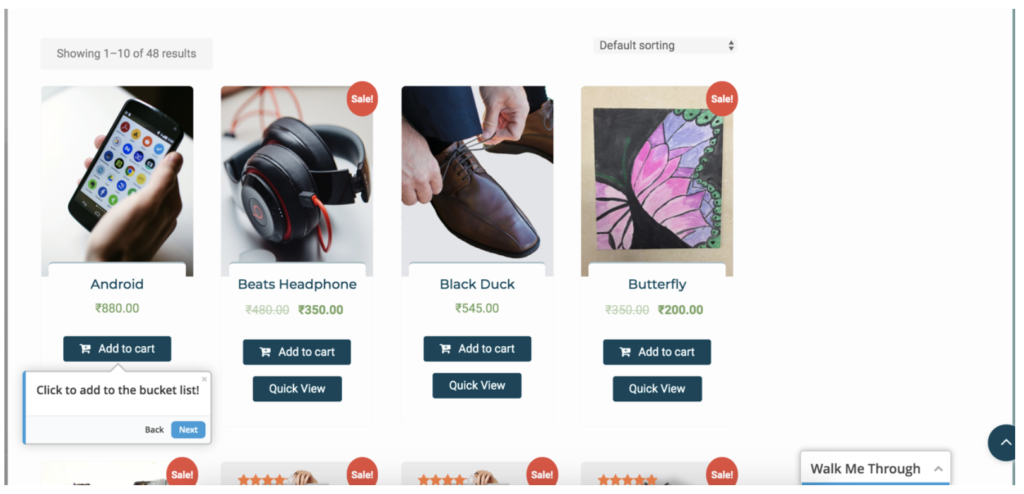
I made a website that’s like Shopify to try some things out. You can find lots of easy guides on making your own online store. No need for tricky coding stuff! The main idea is to make the website work better for people – like a smoother ride for users. Let’s keep it simple and fun! 🌟
The Website walkthrough is guided by walk me application which guides the user through various steps on the page. Again you can refer to tons of resources online to embed the walk-through logic. We will embed this at last after we analyze the pages that show a pattern of user’s navigating throughout the website.
Google Analytics is another piece that is inserted into the website to get all the user data. Google Analytics is like a tool that helps you see how people use your website. To use it:
- Get an Account:
- Make a Google Analytics account. It’s free.
- Set Up Your Website:
- Create a “property” for your website – it’s like a special spot for information.
- Get a Code:
- Google Analytics gives you a code. Copy it.
- Put the Code on Your Website:
- Find where to put the code in your website settings. It’s usually in the header or footer. ( Watch tutorials online )
- Wait a Bit:
- It takes a bit of time for Google Analytics to start collecting data. Soon, you’ll see how people use your site.
Now your website and Google Analytics are connected, helping you understand what’s happening on your site. 📊
Data Prep and Analyzing the Data
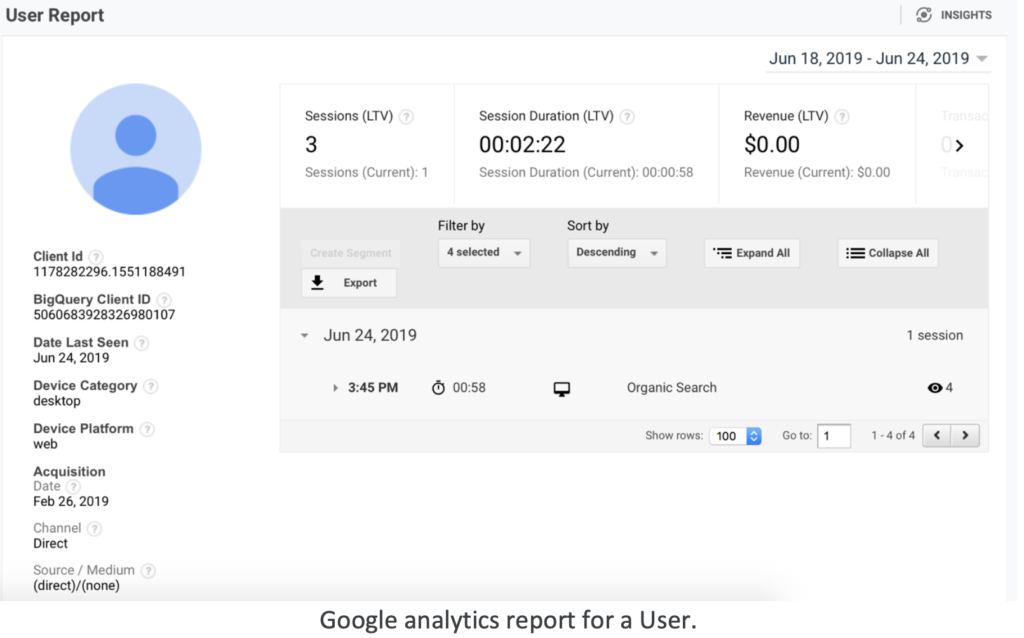
Knowing your users is like having a map for making good decisions about your website, mobile app, or software development. Google Analytics is the tool that helps you get this map.
Here’s a simple rundown:
- Google Analytics Basics:
- With just a little setup, Google Analytics gives you loads of info about how users interact with your site or app.
- Standard Metrics:
- It tells you important stuff like how many users are on your app, the number of sessions they create, and which pages they visit.
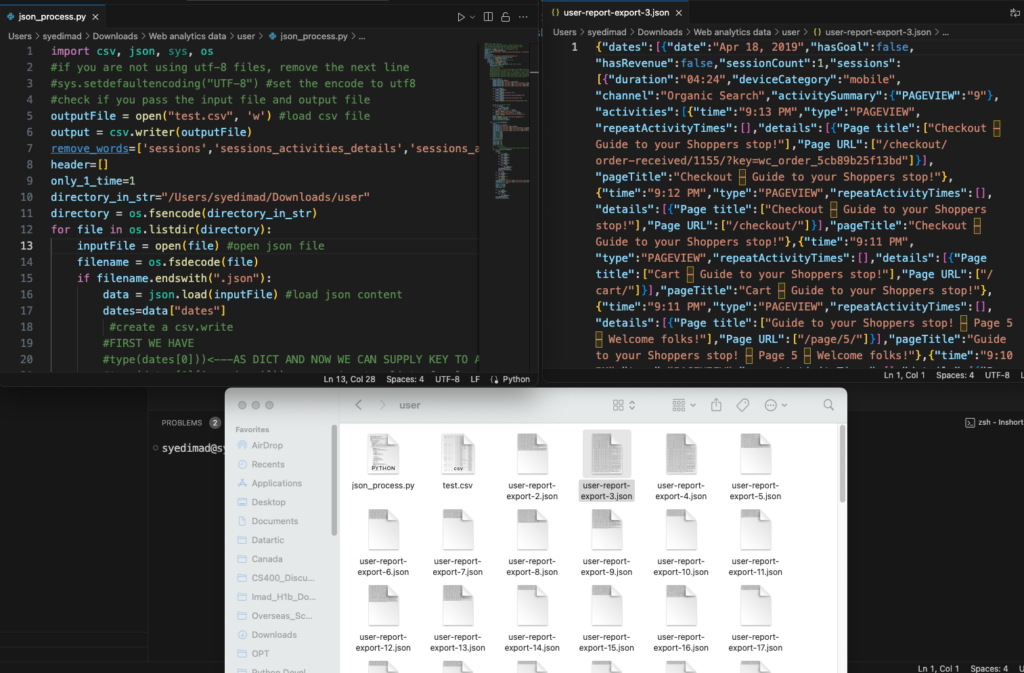
- Data Journey:
- The data comes in a fancy JSON format. We then organize it into a neat CSV file for more analysis.
- Cleaning Up:
- We tidy up the data by removing any duplicates to keep things clear.
- Machine Learning Magic:
- Now, the data is ready for some machine learning action. We use Markov chains to understand patterns and calculate the probabilities of those patterns.
So, in a nutshell, Google Analytics helps you gather insights, and the journey from JSON to CSV to Markov chains makes that data even more powerful for making smart choices!.
Step 0: After Downloading the user reports from Google Analytics, they would ideally be in the form of JSON format. I wrote a Python script that would give the result in the form of CSV by combining all the JSON files. The code can be found in the GitHub Link posted towards the end!
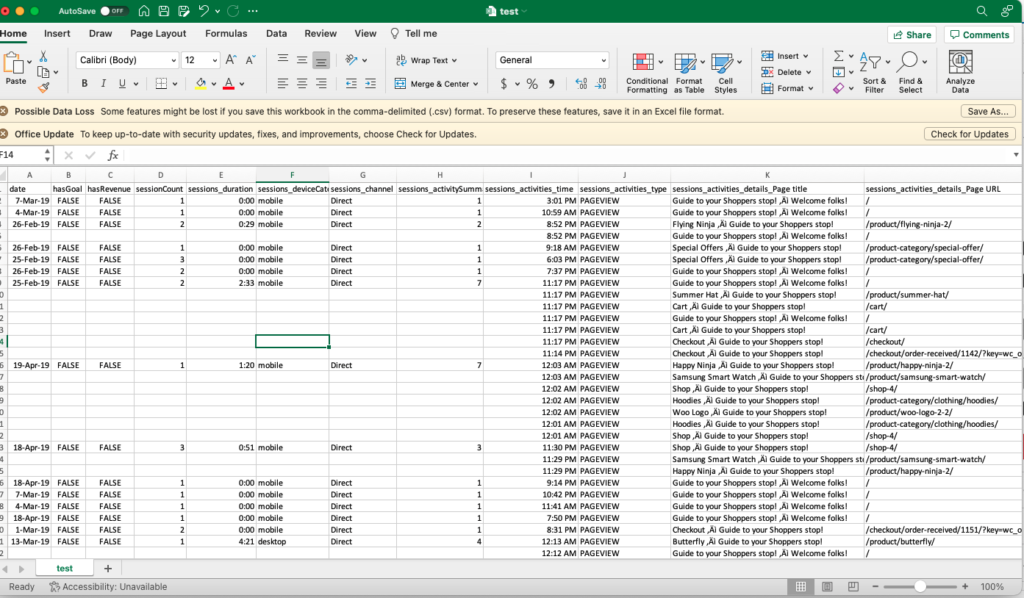
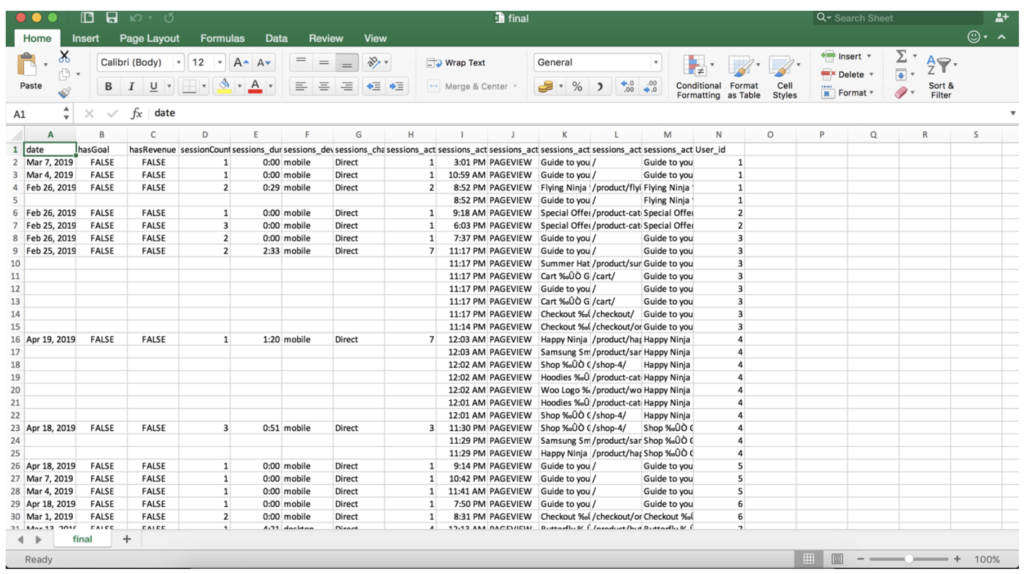
Step 1: After Merging the data of all the users into one common CSV file remove the unnecessary columns .
Note: I do not remember how I created user ID column in the final Excel file. Maybe use the counter or the file name inside the Python script to create a new column user_id to denote the data for that specific user. You can use your logic if the Python code isn’t doing that or use Chatgpt to add the logic.
Step 2: Creating Unique identifiers for each page using UNIQUE function
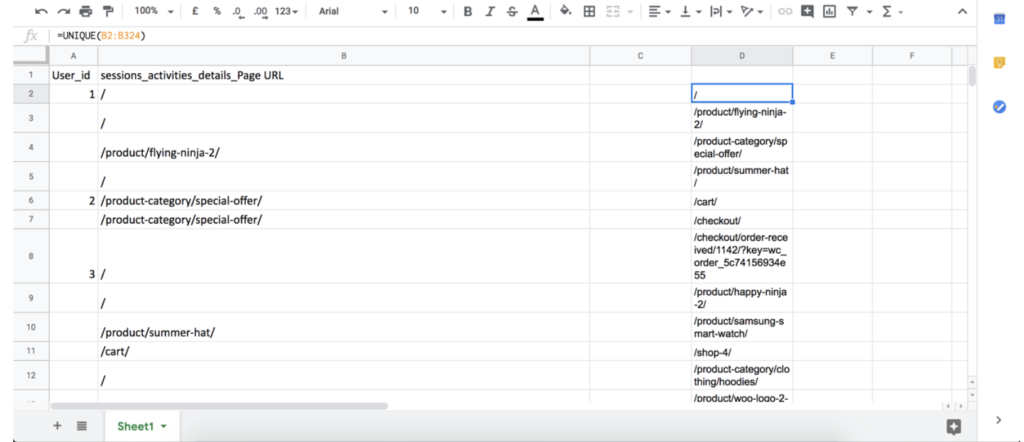
Step 3: Assign a unique identifier for a page(Here for example p1,p2 ..)
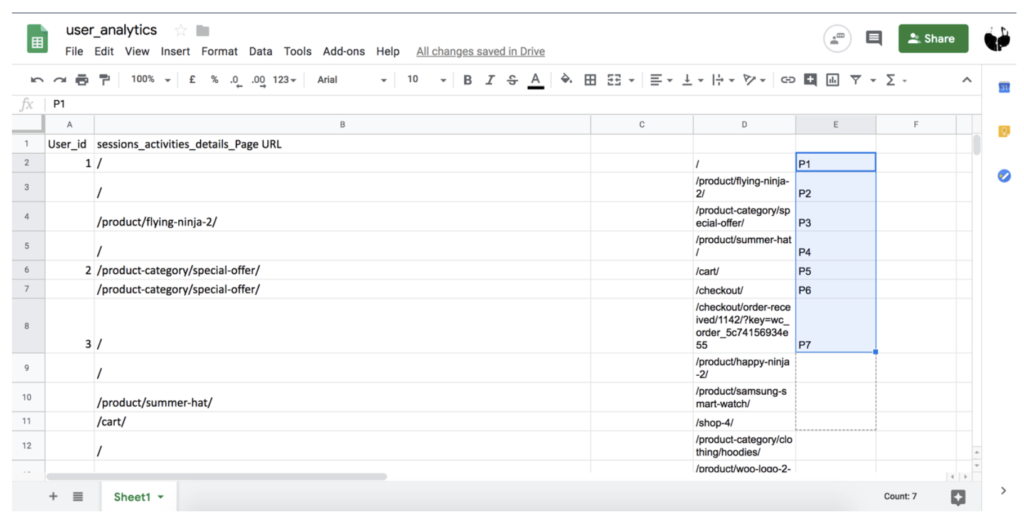
Step 4 : Using Vlookup function assign the unique identifier values for each individual page. In my case—>
=VLOOKUP(B2,$D$2:$E$324,2,false)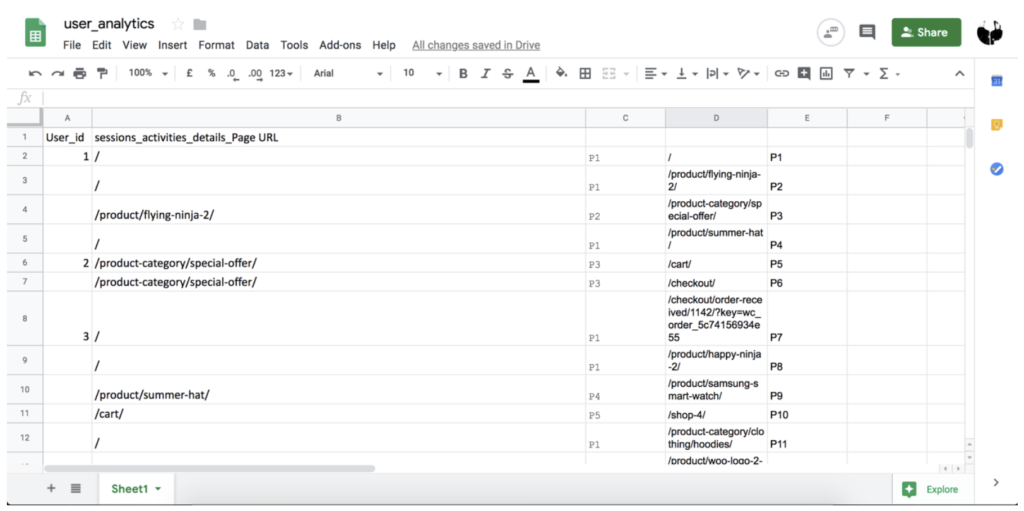
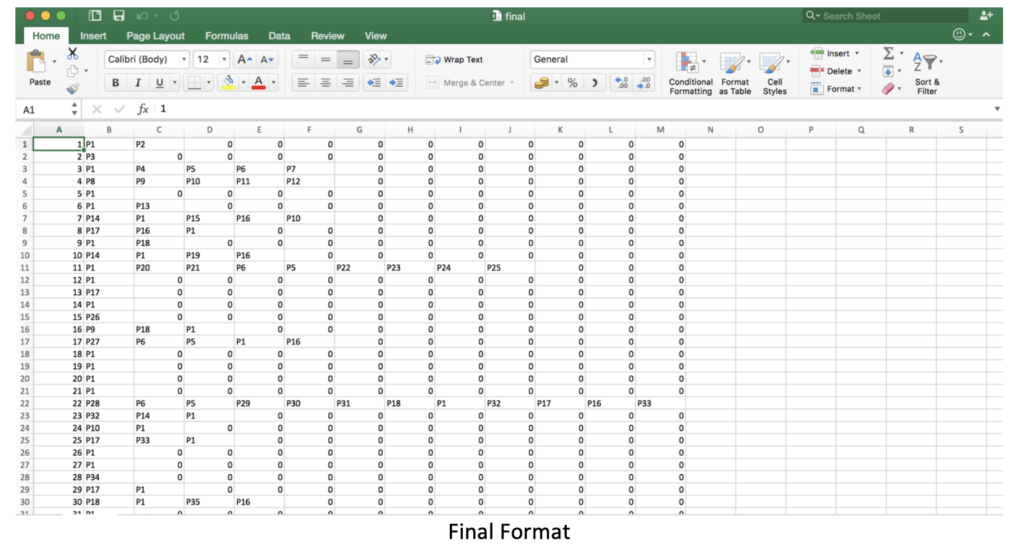
Step 5 : Transpose the values so that we obtain the p1,p2.. values for each user.
Refer- https://www.extendoffice.com/documents/excel/3358-excel-transpose- unique-values.html
Machine Learning – Markov Chains
Markov process is a stochastic process that satisfies the Markov property of memory-lessness. A Markov chain is, in fact, a Markov process too in either discrete or continuous time with a countable state space.
We chose to use 3rd order Markov Chain on the above-produced data as:
- The number of parameters needed for the chain’s representation remains manageable. As the order increases the parameters necessary for the representation increase exponentially and thus managing them requires significant computational power
- As a rule of thumb, we would like at least half of the clickstreams to consist of as many clicks as the order of the Markov Chain that should be fitted.There is no point in selecting a 3rd order chain if the majority of the clickstream consists of 2 states and so there are no state three steps behind to take into consideration.
- Fitting the Markov Chain model gives us the transition probabilities matrices and the lambda parameters of the chain for each one of the three lags along with the Start and End Probabilities.
- Start and End probabilities correspond to the probability that a clickstream will start or end with this specific event. First lets take a look at our data:
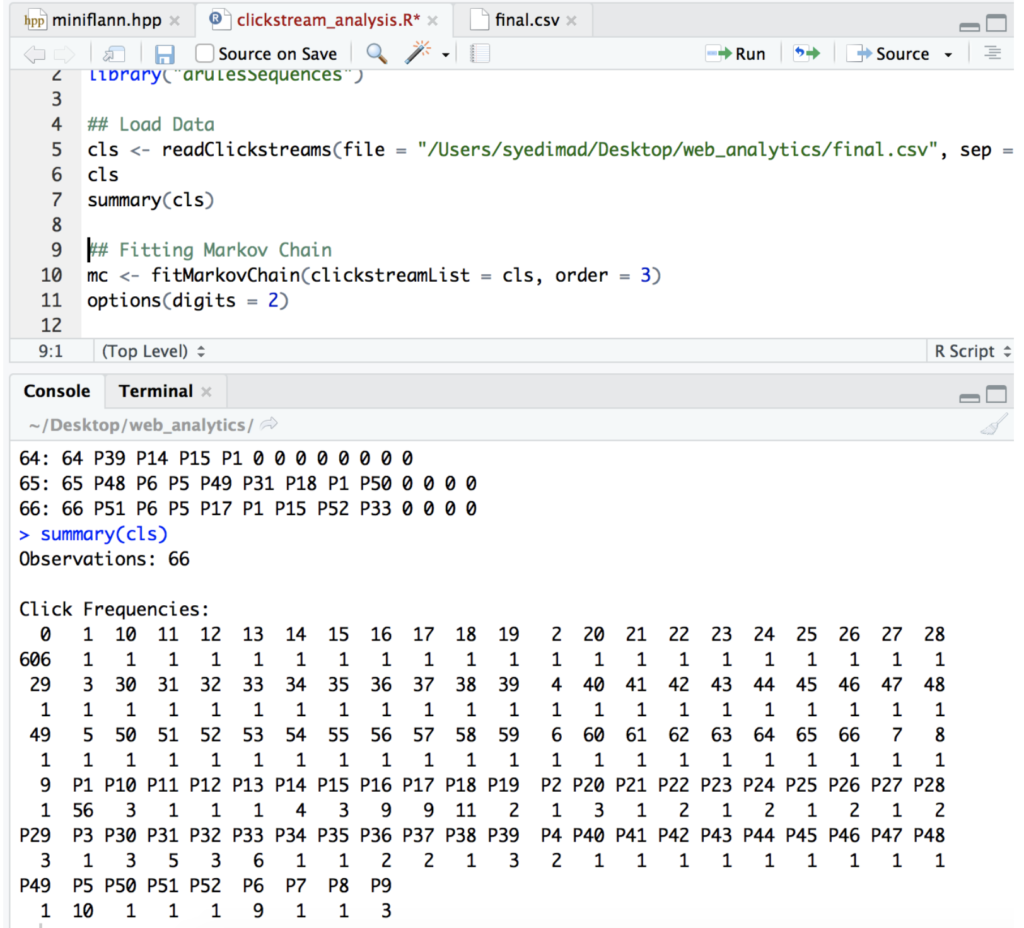
I am using R Studio here for analysis. You can choose to use anything else such as python … etc. There are 66 users and each user’s frequency is displayed. We then fit the data into the markov chain and calculate transitional probabilities.
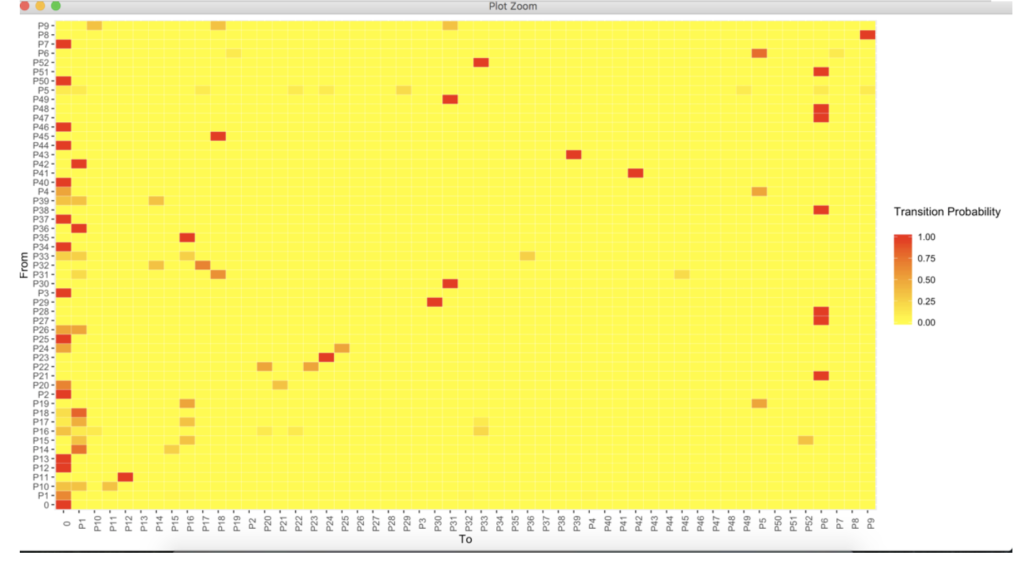
As you can see above the transitional probabilities from 1 page to another is higher for a lot of different pages. Example P0 (Home page)->P12 , P9->P8 … etc which gives us insights to what the consumers are really looking at.
Suggestion for UI/UX designer:
From the above transitional probabilities we can observe that :
- Womens collection is more preferred but is not accessed from home page but from other pages which may result in a lengthy path for a user and we may lose the User, so hence we have to provide Womens collection offers at the home page inorder to increase sales.
- Beats Headphones are purchased only from mens accessories but not from home page because of its less visibility between other products.These must be highlighted in order to sell this product.
- Pashmina shaul product is a preferred product but due to its lack of visibility on the home page the sales are less.
- Butterfly product image size must be reduced as it occupies large screen space.
- Image resolution and other methods should be applied to increase the Website performance speed
- On sale products must be featured on the top of the page rather on the footer as the featured products have been sold more than other products and this strategy may increase sales.
- Sidebar can be implemented to display trending items and various offers to lure the customers into buying the product.
Conclusion
However, all this analysis is worthless unless it is driving actions. Based on the above results a recurring process of reviewing must be initialized regarding web or application design and
GitHub Link : https://github.com/syedimad1998/Analyze_User_Workflow